Press release
National Index MARCH 2008
All Houses, All Buyers Index (1983=100)
Index (seasonally adjusted) 620.0
Monthly Change -2.5%
Annual Change 1.1%
Standardised Average House Price (seasonally adjusted) £191,556
- House prices fell by 2.5% in March. Prices in Quarter 1 were 1.0% lower than in 2007 Quarter 4. House prices in March were 1.1% higher than a year earlier.
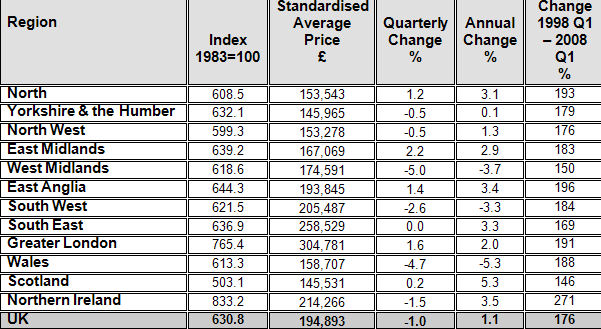
- As expected, there was a mixed regional picture. The biggest rises were in Greater London (1.6%), East Anglia (1.4%) and East Midlands (2.2%). There were price falls in a number of regions with the biggest falls in West Midlands (-5.0%) and Wales (-4.7%).
- Overall, we expect there to be a modest (low single digit) decline in UK house prices this year. Any declines, however, should be viewed in the context of the significant price rises over recent years. UK prices have increased by 171% over the past ten years and by 51% over the last five years. The average UK price has risen by £120,860 during the past decade from £70,696 to £191,556.
- All 12 UK regions have experienced substantial house price rises over the last ten years, ranging from 146% in Scotland to 271% in Northern Ireland. Average prices increased by 191% in Greater London, 188% in Wales and 150% in West Midlands during the period.
- Sound economic fundamentals are supporting house prices. A strong labour market, low interest rates and a shortage of new houses underpin housing valuations. Employment is at a record high and unemployment continues to fall. Employment stands at 29.5 million and has risen by 370,000 over the past year. Unemployment is below 800,000 and has fallen by over 125,000 in the last year. We expect there to be a modest rise in unemployment later in the year, but the scale of the increase is unlikely to cause widespread difficulties for households.
Commenting, Martin Ellis, chief economist, said:
"House prices fell by 2.5% in March. Prices in 2008 Quarter 1 were 1.0% lower than in 2007 Quarter 4.
Overall, we expect there to be a modest fall in UK house prices this year. Any declines, however, should be viewed in the context of the significant price rises over recent years. The average UK price has risen by £120,860 during the past decade from £70,696 to £191,556; an increase of 171%.
Sound economic fundamentals are supporting house prices. A strong labour market, low interest rates and a shortage of new houses underpin housing valuations. Our research shows that the labour market is the key driver of the housing market. Employment is at a record high and unemployment continues to fall."
House prices increased in some regions during 2008 Q1 ……
The biggest price rises were in Greater London (1.6%), East Anglia (1.4%) and East Midlands (2.2%). There were also gains in the North (1.2%) and Scotland (0.2%). Prices in the South East were unchanged.
Falls in other regions follow substantial gains in the past ten years ……
There were house price falls in six regions with the biggest falls in West Midlands (-5.0%) and Wales (-4.7%). These declines should be seen in the context of the substantial price rises recorded in these regions over the past ten years; West Midlands (150%) and Wales (188%).
There were also price declines in the South West (-2.6%), Northern Ireland (-1.5%), Yorkshire & the Humber (-0.5%) and the North West (-0.5%). These falls also follow strong gains in the past ten years (see Table 1 for details).
Most regions have seen a rise in prices over the past year led by Scotland and Northern Ireland
Nine of the 12 regions of the UK have recorded an increase in house prices over the past year. The biggest rises have been in Scotland (5.3%) and Northern Ireland (3.5%). Three regions have experienced a modest fall in prices during the last 12 months: South West (-3.3%), West Midlands (-3.7%) and Wales (-5.3%).
Strong labour market underpins the housing market
The labour market is the key driver of the housing market. Employment is at a record high and unemployment continues to fall. Employment stands at 29.5 million and has risen by 370,000 over the past year. Unemployment is below 800,000 and has fallen by over 125,000 in the last year.
Homebuyers are in a stronger position than in the past
Buyers have been putting down bigger deposits than in previous cycles. 82% of all new borrowers put down a deposit of more than 10% of the house price during the final quarter of 2007. By contrast, 56% of new borrowers put down a deposit of more than 10% in 1989 and 1990.
The average deposit put down by a first-time buyer (FTB) in 2007 (£34,381) represented 20% of the purchaser price compared with 12% in 1989. Only 5% of FTBs took out a loan of 100% or more of the purchase price in 2007 compared with 35% in 1990.
More than a third (35%) of owner-occupiers in Britain own their home outright. (There are 11.8 millions households with a mortgage and 6.3 million households owning outright.) In addition, nearly one in four (25%) of properties bought each year are bought with cash.
Fewer FTBs and housing transactions in recent years
Total house sales have been much lower in the last few years compared with the height of the 1980s boom. There were, on average, 1.15 million transactions in England & Wales in the last three years (2005-2007). This was a third – 560,000 - lower than in 1988 when there were an estimated 1.71 million transactions.
FTBs also account for a significantly smaller proportion of new mortgage borrowers: 30% against nearly 50% in the late 1980s.
Table 1: All Houses, All Buyers (Seasonally Adjusted)
1st Quarter 2008 – Quarter Averages